DIG Average True Range (ATR)
The standard ATR is an amazing indicator, but it has one major inherited flaw.
When we use a volatility indicator such as the ATR, we want to know the real price action by how much the next bar goes up or down. However, when gaps have significant influence, as in the standard ATR, we no longer get what we want. After a large gap, the standard ATR indicator no longer reflects the real price action volatility.
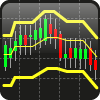
Take a look at the chart below, which compares the standard ATR indicator (light blue) with the DIG ATR indicator (yellow).

AAPL 60 Min Chart:
The chart compares our improved DIG ATR (yellow) with the standard ATR (light blue) indicator. Notice that even when a medium-sized gap occurs the standard ATR indicator jumps up and no longer reflects the actual price range, while the DIG ATR reacts to the gap in a much milder manner and continues to accurately reflect the price range. Also notice that when the market has no gaps the indicators are almost identical.
Most traders use the standard ATR to place StopLoss and TakeProfit orders. If you are one of these traders, you really need to try the DIG ATR indicator (which is free). The indicator will help you get more from your trades by providing you with more accurate data.
Key Features :
- Adjustable length.
- New extra feature – select the type of calculation [ full candle / only body ].
- The indicator is also provided as a function.