DIG % Bar Bias
What Is the DIG % Bar Bias Indicator?
Volume plays a major role in our trading decisions. The %BarBias indicator gives you insight into the power struggle going on inside the bar by providing you with a chart representation of the ratio between buying and selling volumes. No sub-graphs are needed; just add the data to the chart and get that crucial bit of information exactly where you need it.
Lets see the indicator in action:

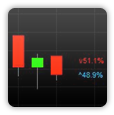
@ES Futuers 60 Min Chart: The down volume is represented by the red text on the top of the bar (63%), and the blue text on the bottom of the bar represents the up volume. Together, the sum will always be 100%.

AIG 5000 Tick Chart: Here you can clearly see the power of the indicator; it works great on minute charts, as well as tick and volume charts, giving you the extra boost you need.
Key Features:
- Easy to use.
- Control text color.
- Works great with tick, volume and minute bars.
- No sub-graphs needed!