DIG MTF MA – OOEL
What is the Multi-Time Frame MA – OOEL
We have put a lot of time and effort into this tool and it is a masterpiece. All of the new OOEL capabilities are now put to use in your favor, to give you the competitive edge you seek.
This unique indicator allows you to plot moving averages (simple, exponential, weighted) on any chart from any time frame. You can put a 60 Min SMA on a 5 Min chart or a Weekly WMA on a daily chart, and you can even take it to the extreme and place a 5000 tick SMA on a 15 Min chart. The possibilities are limitless.
Lets see it in action:

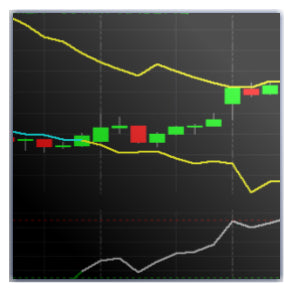
AMZN 15 Min Chart: On the chart, you can see a 60 Min SMA when the symbol on the chart is only 15 Min.

GBPUSD Forex 15 Min Chart: Here we have an example of a weekly SMA being plotted on a 60 Min chart. The possibilities are endless and we have given you full control to use it as you see fit.

AAPL 15 Min Chart: This employs a unique new approach; you can now place a 5 Min SMA on a 15 Min chart, providing you with a much tighter and more responsive MA.
Key Features:
- Easy to use.
- Full control.
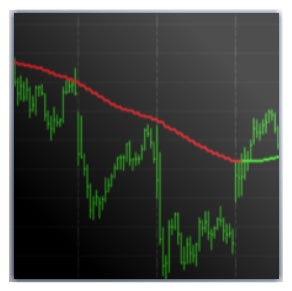
- Directionality color feature.
- Plot any time frame on any chart!
- Support of minute, daily weekly and monthly MAs.
- Plot MAs of other symbols on the chart (great for forex ) – premium version only
- SMA EMA and WMA – EMA supported only in Premium Version
- Plot tick MA’s on minute charts and minute MAs on tick chart – premium version only
Preimum Version
Take this great indicator to the next level. Use it on tick charts, plot EMA lines, and plot other symbols on the same chart (great for Forex traders).
Lets see it in action:

AAPL 500 Tick Chart: On the chart above you can see the true power of this great indicator―a 15 Min EMA line being plotted on a 500 tick chart.

AAPL 500 Tick Chart : Full Tick support – this is an example of the 2500 Tick EMA plotted on a 500 Tick chart.

GBPUSD 500 Tick Chart: You are now able to not only use tick charts and tick data for the MA, but you can also take it one step forward and plot multiple symbols on the same chart; above is an example of a 500 tick MA of GBPUSD, AUDUSD, and EURUSD all plotted on the same chart. You can get the full picture you need at one glance
- Easy to use.
- Full control.
- Directionality color feature.
- Plot any time frame on any chart!
- Support of minute, daily weekly and monthly MAs.
- Plot MAs of other symbols on the chart (great for Forex )
- SMA EMA and WMA
- Plot Tick MAs on minute charts and Minute MAs on tick chart