DIG Magic Bars
What is The DIG Magic Bars Indicator?
This is a revolutionary indicator, who’s single purpose is to identify key price points. Always after such a point the market goes into a strong trend, and most these points are key reversals.
This indicator provides high probability signals both on High Time Frames such as Days or Weeks and on low time frames such as minutes or hours. The DIG Magic Bars indicator bears some resemblance to the well known Better Volume indicator, but we have taken it much further. The Indicator uses price action, volume, candle patterns and advanced mathematical algorithms to point out for you exactly where these key reversals and trends take place.
How do I use the DIG Magic Bars Indicator?
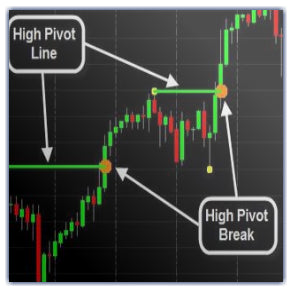
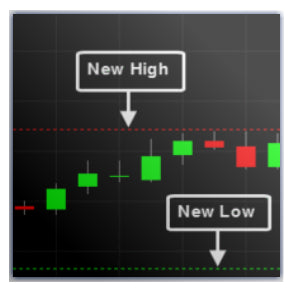
The indicator will color the bar blue or plot a blue dot above and below the Key bars it identifies. These key bars are usually found in areas with low volatility but with very high trade volume. These are the key points, this is where the big players make their decisions about which direction the market is heading. We simply have to listen to what they are saying. We always recommend to use more then one indicator and your own market understanding when making a decision about entering a trade.

AXP Daily Chart: Notice how cleary the MagicBars indicator points out the key bars, the bars are colored blue, and a large dot appears above and below the bar. Notice how all the 4 key points result in a major trend.
- Point #1 comes after a nice up trend and at the highest price area, in such case we usually expect a sharp reversal, and that is exactly what we end up with.
- Point #2 again as you see after a nice up trend in a area of a small conjunction at highest price area, and again a very nice reversal.
- Point #3 this is a different case as you see it comes after a long conjunction ( even though the conjunction came after a long down move ) in such a case we do not assume where the price movement will go, we wait for a bar or two to see the direction and then join the trend.
- Point #4 is the best signal we can expect after a very strong and fast down move we get a Key point and a great reversal, for those of us who are a bit afraid to just jump into such trades you could have waited a bar or 2 to get confirmation for the direction of new trend

NYX 15 Min Chart: This time lets take a look at a lower time frame. Notice how once again all the 6 key points result in a major trend.
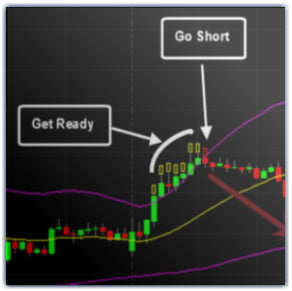
- Point #1 is right in the middle of a strong down trend, so we pay attention to the next bar, we have a strong down gap so we go short.
- Point #2 comes after a strong long downtrend in such a case we expect a reversal and that is exactly what takes place.
- Point #3 this is the ideal point to reenter or increase our holding in the trade we entered in point 2, a long conjunction area we wait a few bars and see a nice up gap and an up trend and we go Long.
- Point #4 after a long up trend we expect a reversal and which results in a nice but relatively short down trend.
- Point #5 after a nice up trend, and a conjunction we expect a reversal and we end up with a magnificent gap in our favor.
- Point #6 after the gap we have a nice key point indicating that again the big players are about to turn the market, we go Long into a beautiful up trend.
DIG Magic Bars Radar Screen / Market Analyser Version
Our radar screen will help you trade just like the pros. It will enable you to see the DIG Magic Bars signals for multiple assets at one glance.

Key Features:
- Configure the way Key Points are shown ( Paint Bar / Dots )
- Very easy to use.
- Can be used with any other indicator.
- New Feature – Built in alerts.