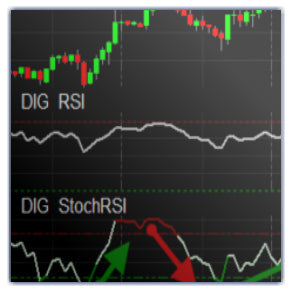
DIG RSI
Our DIG RSI indicator is based on the Traditional RSI, but we gave it a major face-lift.
It now comes with a new look that is visually enhanced and easy to use.
What is RSI and what can I do with it?
RSI ( Relative Strength Index ) is a technical momentum indicator that was developed by J. Welles Wilder. The RSI compares the magnitude of recent losses and gains in an attempt to determine weather a given asset is oversold or overbought. The RSI is actually an Oscillator, meaning that it has Minimum and Maximum values, it ranges from 0 – 100.
Traditionally it is considered that when the RSI is above 70 the market is Overbought and when the RSI is below 30 the market is oversold.

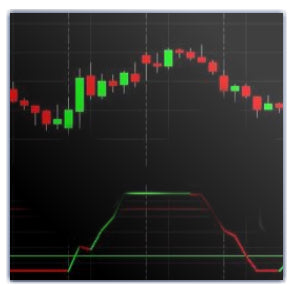
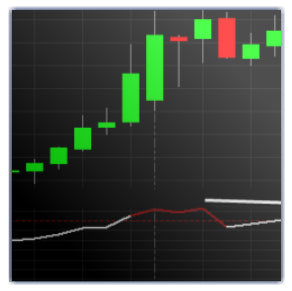
AEP Daily Chart. Notice that when the RSI enters the Oversold zone the indicator changes color to Dark Green and when the RSI enteres the Overbought zone it changes to Dark Red. This makes it very easy to use.
Ways to Use the RSI Indicator
Entry Signals : The RSI can be used to recognize a change in trend direction. When the market is moving up the RSI will eventually cross over the overbought level, when this happens we get into to a READY state, when the RSI crosses down below the Overbought level we have a Short Signal. When the RSI signals for a short we should not jump in straight away, we need to understand the overall conditions of the market and use our knowledge and other helping indicators.

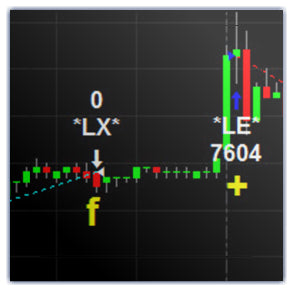
AMZN Min Chart:
When the RSI enters the OverBought Zone ( the indicator turns red ) we get ready. When the RSI cross below the OverBought Line we have a short signal. We have 2 red bars with momentum so we Go Short.
Trend Direction: The RSI indicator can also be used to tell the overall direction of the market, Over 50 Bullish Trend, Under 50 Bearish Trend. This is correct up to the moment we get a Signal to the opposite direction as described above
Divergence: Another very common way to use the RSI indicator is Divergence. We have created a special indicator that automatically finds RSI Divergences – It will become available in a few weeks. You are probably familiar with is idea, if not here is a quick explanation.
Divergence Long Example : The indicator has 2 Upper pivots and the recent one is Lower, meanwhile the price has 2 Upper Pivots when the recent one is Higher. This is a Bearish Divergence, so we expect a Short Trade.

AMZN 30 Min Chart. We have a lower Upper Pivot on the RSI, and a higher Upper Pivot of the price, also notice that the RSI is OverBought this is a great bonus. This Signal resulted in a very nice Short Trade.
- Adjustable Over Bought, Over Sold Levels
- The indicator Changes color according to location: Normal, Over Bought, Over Sold
- Build in Alert feature