DIG Keltner Channel 2.0
What Does the DIG Keltner Channel 2.0 Have to Offer?
We took the standard Keltner Channel and enhanced it.
We added separate band controls and painted the bars, making it a one-glace indicator.
Keltner Channel
The Keltner Channel is based on a moving average line with upper and lower bands. The bands adapt according to the volatility of the asset (average true range). The Keltner Channel is used to signal price breakouts and price breakins, and to show trends.
Let’s see the indicator in action:

AMZN 60 Min Chart: TThe middle gray line is the moving average line, and the two yellow lines are the upper and lower bands. (You can set the colors and width according to your needs.)
The real magic of the indicator is the paint bar:

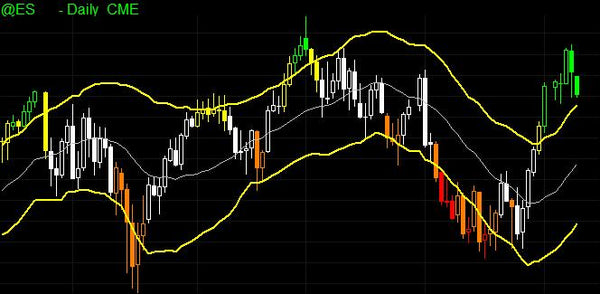
@@ES Futures Daily Chart: The bars are color coded according to their location.
Bars above the Upper Band: Green
Bars Above the Lower Band with highs above the upper band: Yellow
Bars between the Two Bands: White
Bars below the Upper Band with lows below the lower band: Orange
Bars Below the Lower Band: Red
With color-coded bars, you can take one glace at this indicator and receive all the information you need.
We highly recommend using this indicator with one of the following two reversal indicators: DIG Magic Bars, DIG Smart Points
Key Features:
- Absolutely free
- Control the upper and lower band separately
- Amazing paint bar feature
- Works great with DIG Magic Bars and DIG Smart Points Indicators


